
Hunt Journal
Track hunts and spot patterns
Log each hunt with date, location, species harvested, and notes so you can track patterns and improve over time.
FowlTracker helps you see where ducks are roosting, compare past dates, and plan smarter hunts around weather and conditions.
A simple routine before every hunt
Check today, compare to past dates, and use weather to decide if it is worth the drive or taking off work.
Compare historical dates before you make the call
A single day can fool you. Compare dates from past seasons, including the same date year over year (for example, Nov 7), before you spend the drive and the morning. This is historical comparison, not future prediction.


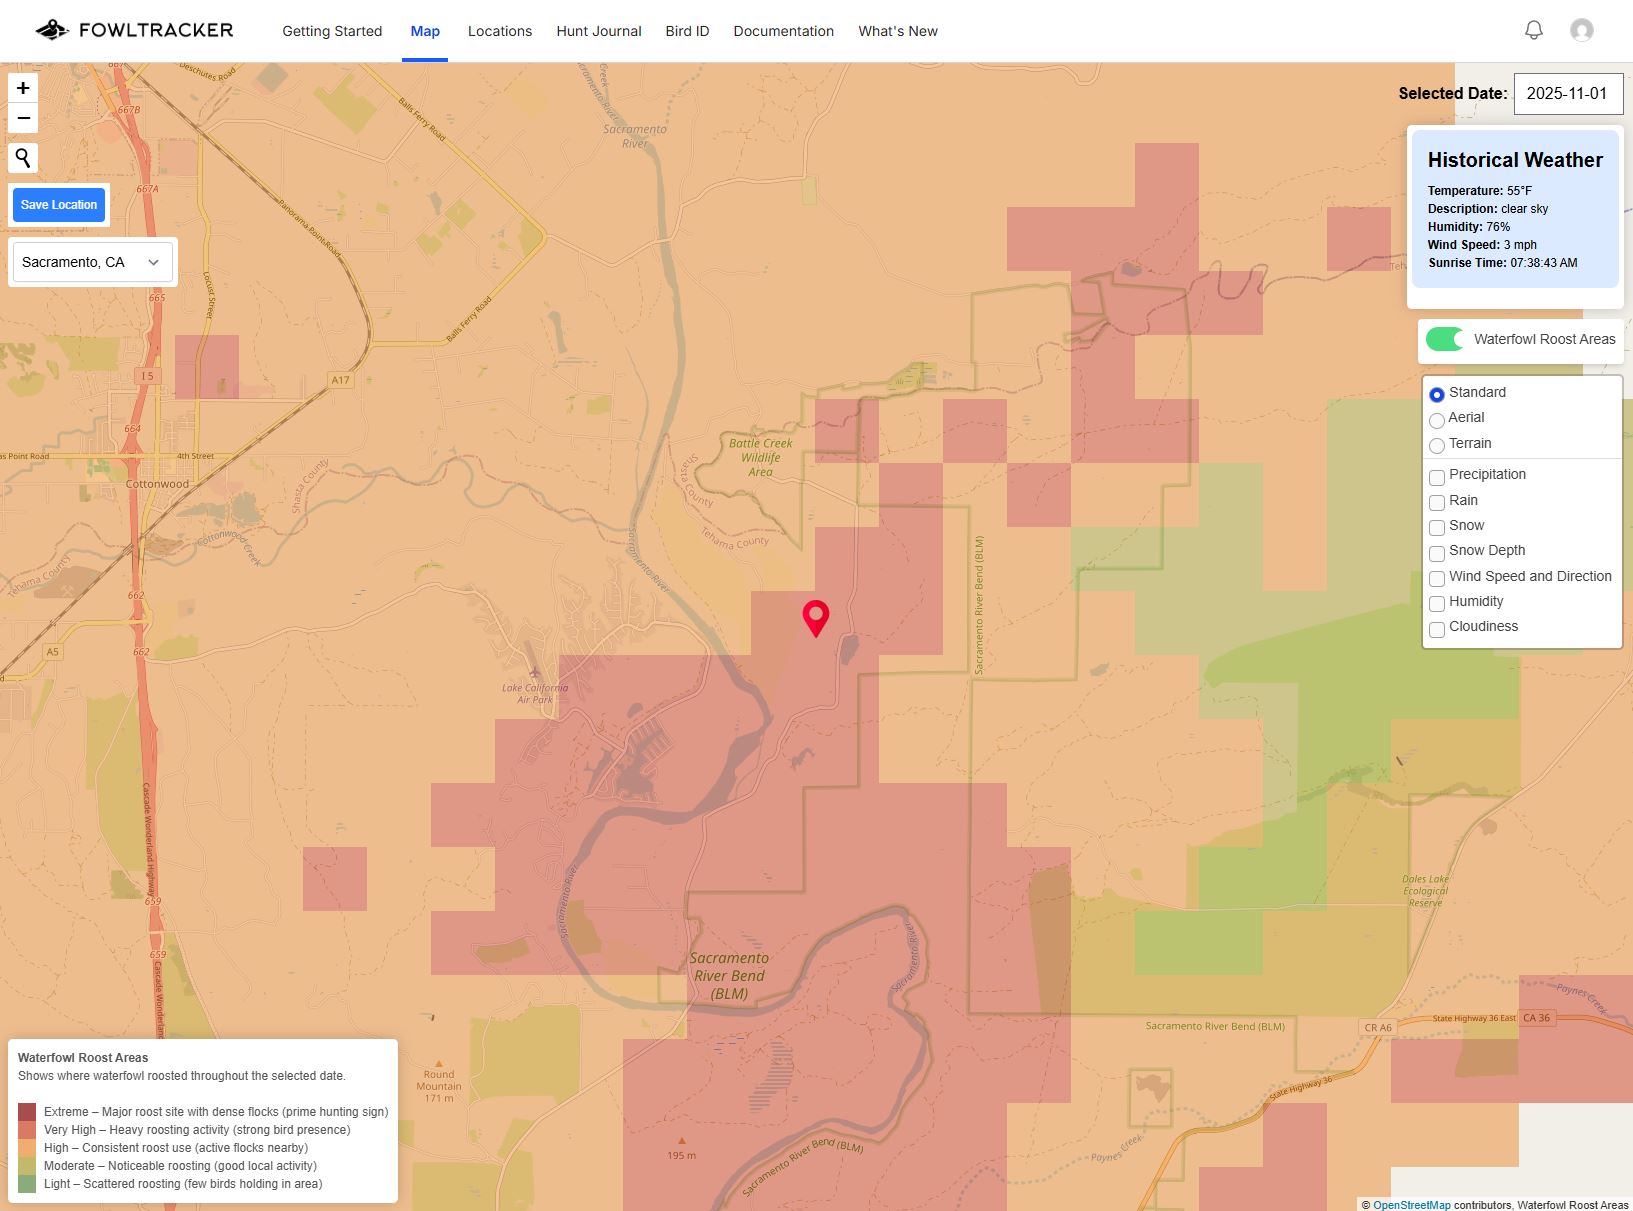
Line up weather with where birds are roosting
FowlTracker puts weather context next to roosting activity so you can make better go/no-go calls before you leave the house.
Tools hunters use all season
Track hunts and spot patterns
Log each hunt with date, location, species harvested, and notes so you can track patterns and improve over time.

Identify birds from your photos
Upload images to a hunt entry and BirdID helps identify species in your photos.

See the Best Days to Go
Review historical roosting maps from November 1 to March 31, with data available starting November 1, 2022.

Send private hunt links
Share individual hunt entries with friends and hunting partners using a private share link.
Current coverage map
Here is where coverage is live right now. We are continuously expanding and working toward nationwide coverage by August 2026.
"I have been combing through the data, comparing it to what we have seen in the field, and it is directly on point."
"It is very clear that you guys listen to feedback and want to create a good product for users."
"This is what attracted me to your product in the first place. We can have really good hunting if the conditions are right."
Simple plans for every hunter
Start free, then upgrade when you want full-season historical access and premium tools.
Full access to all features with limited historical data.
$0
Sign UpFull access to all features including complete historical data.
$9.99 /month
Sign UpFull access to all features including complete historical data.
$99 /year
Sign UpThe Waterfowl Roost Areas legend is below.
Extreme
Major roost site with dense flocks (prime hunting sign)
Very High
Heavy roosting activity (strong bird presence)
High
Consistent roost use (active flocks nearby)
Moderate
Noticeable roosting (good local activity)
Light
Scattered roosting (few birds holding in area)
Right now, Mississippi Flyway and Atlantic Flyway have full coverage. We also have data in parts of California, Colorado, and Montana. Coverage is expanding continuously, and our goal is nationwide coverage by August 2026.
Weather swings and migration pushes can move birds fast. Use day-to-day trends with weather overlays instead of relying on one date alone.
FowlTracker combines radar, weather, telemetry, and habitat data to map where birds are roosting so you can plan hunts with better context.
Yes. Many hunters use saved locations, date comparison, and weather layers to decide which hole, blind, or field setup gives them the best shot.
On Free, you get full access to all features, but historical date access is limited to November 1. Premium unlocks full historical date access.
Start free, check your spots, and see how it lines up with what you are seeing in the field.